- Art & Image Generator
- Infography
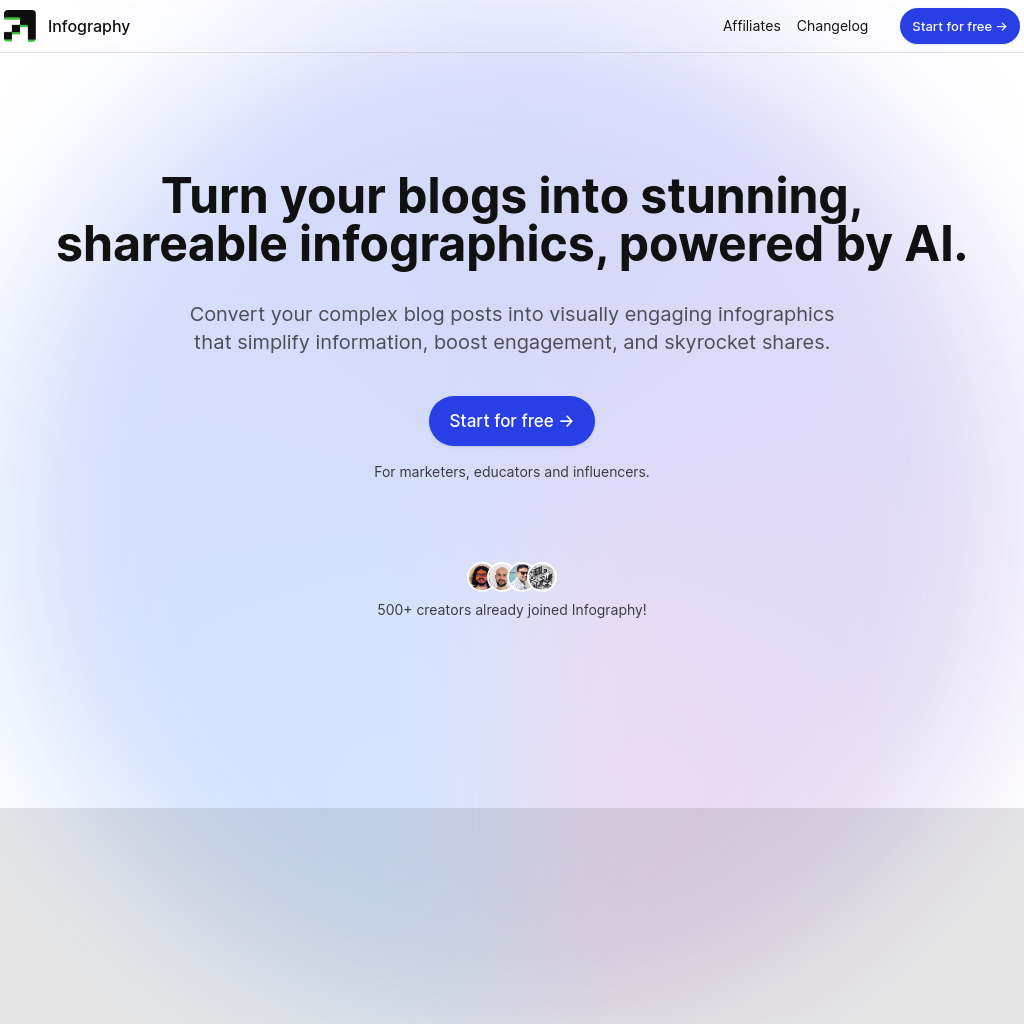
Infography - 將您的博客轉換為驚人的可分享信息圖,AI驅動
导言
使用Infography轉換博客內容為引人入勝的可共享信息圖,提升互動、吸引新受眾,並增加SEO效果。
Infography's 概述
Infography is a powerful tool that allows you to convert your complex blog posts into visually engaging infographics, powered by AI. By simplifying complex information and using visuals, icons, and charts, Infography makes it easy to digest and share your content. Infographics are highly engaging and perform well on social media platforms like Pinterest, Facebook, and Twitter, attracting attention and driving traffic back to your blog or website. You can also promote specific products or services with infographics, highlighting their key features and benefits. Repurposing existing blog posts into infographics is a great way to extend your content's reach. Additionally, by including relevant keywords and embedding the infographic on your website, you can improve your search engine ranking. Infography offers different tier plans, with lifetime access and the ability to customize text, colors, and more. If you have any questions, their refund policy allows for a hassle-free refund within 30 days of purchase.
Infography's 特点
Simplify complex information
Increase engagement and shareability
Attract attention on social media
Infography's 问答
Infography's 定价
Infography offers different tier plans: Tier 1 for content creators, educators, and influencers, Tier 2 for solopreneurs and startups, and Tier 3 for marketing agencies. Lifetime access is provided with one-time purchase plans.
Infography's 分析
网站概述
关键性能指标 infography.in
跳出率
51.18%
页面/访问
4.37
总访问量
3,335
现场时间
1m 43s
全球排名
#4,688,566
国家排名
#71,487
顶级地区
按国家分列的交通流量分布情况
- 1.Colombia28.84%
- 2.United States18.29%
- 3.Argentina11.01%
- 4.India9.53%
游客总数
过去 3 个月的每月访客统计
流量来源
流量来源分布

